Welcome! Our “Unlocking AI potential in e-commerce and online business” series aims to provide basic guidance on applying AI (Artificial Intelligence) in businesses which use the internet as a primary source for delivering value to their customers.
In today’s article we will discuss what to think about when predicting future events. Hope you will enjoy your reading!
Clouded the future is.
Winter is coming. Christmas and New Year’s Eve are considered a magical time. Some cultures believe that during this period it is possible to see the future. Divination and fortune-telling rituals have been around for centuries. Every king had a prophet or a druid who was supposed to be in contact with the gods and could predict the future.
Nothing much has changed since then, only nowadays they are called data scientists. Unfortunately, sometimes the same applies to the performance of the predictive algorithms. What can a modern “seer” do to make models better than a crystal bowl?
How AI works behind the scenes? You can find a few examples in this article in our “Unlocking AI potential in e-commerce and online business” series!
Creating and losing the customer
In one of our previous articles we dove into phases of data-driven projects. One of them is Discovery phase – problem and data understanding. When dealing with predictive analytics, this phase determines the success or failure of the whole project.
We are often dealing with forecasting events whose real meaning is not that obvious. A prediction of losing a customer (churn) is one of them.
Periodic purchase
Imagine the following scenario:
- Jane has a dog. She buys dog food in our store each month. To this date, it has been six months since her last purchase.
Is that a churn? How our judgment changes after receiving new information:
- Approximately half a year ago, Jane started to live with her boyfriend Peter. Since then, Peter has bought dog food from us each month.
Who is the real customer in this case? Whose need is being satisfied? Who do we deliver the value to? Is it Jane? Is it Peter? The dog’s demand is transferred to Jane and Peter. They are basically middle men.

We can find similar examples in many other businesses. Modeling of the customer retention and churn is relevant in all industries which are based on repetitive consumption of goods or services. One of them is telecommunications.
Subscription
The Smith family has four members; mother, father, twelve-year-old daughter and eight-year-old son:
- Both parents use an unlimited mobile plan from a telecom company TC_1.
- Daughter uses a top-up mobile plan from a telecom company TC_2.
- Son does not have his own cell phone yet.
This set-up will be changed in the near future. The parents consider their son old enough to have his own cell phone. Because of that, they have decided to use a family 4-line plan from the company TC_2 for all family members.
How will these changes affect the data?
- Company TC_1 will lose two customers (mother, father).
- Company TC_2 will lose one customer (daughter), but a new contract will be signed. This new contract includes the lost customer and three new customers (mother, father, son).
The question is the same as in the previous case – who is the customer? Three existing single customers will become one unit – the family. If the company TC_2 labels the event of losing the daughter as churn, it will create noise in the data. Such noise can negatively affect the performance of predictive models.

Abstraction of the reality through data
Besides the definition of customer, companies often struggle with representing events and their context. It’s impossible to create a model with sufficient performance if data does not contain the necessary information.
Cutting the waiting time in a queue
Let’s think about this case:
- The goal is to optimize the number of shop clerks on a shift in a store to reduce the queue waiting time to a maximum of two minutes.
- We have data about past transactions from cash registers.
It’s quite intuitive to think about analyzing the cash register data first. More transactions in some hours or days means more employees are needed in these periods of time. Is this correct? Imagine the following series of events:
- I just got off the bus and am going to a meeting. The meeting starts in thirty minutes. I know I can make it in twenty minutes if I go fast.
- The meeting is early in the morning and I skipped breakfast. I suppose I will buy something on the way.
- I am passing the store. I see the long queue through the window. I am hungry, but I will not risk being late. After the meeting I will go to a restaurant.
- The store just missed an opportunity.
Will my demand appear in the cash register data? We have data about transactions which took place. In other words, we know what kind of load the employees were able to handle. Nevertheless, we have no information about missed opportunities, the number of people in the store or queue waiting times. We are missing the key variable whose value should be predicted and optimized. Is the available data sufficient?

Data quality
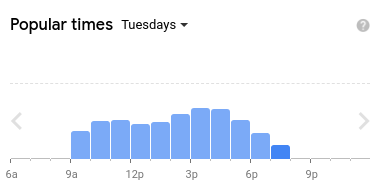
Let’s continue with the last case regarding the queue in a store. What kind of data could reveal the queue waiting times in the past? We have several options, for instance using data from security cameras, an expert guess or a histogram of popular times from Google Maps. Each data source has its pros and cons:
- Data from cameras – We can get a lot of information using this approach. Unfortunately, we need a proper technical solution. The data should be stored somewhere, and we need another algorithm to detect people in the queue and compute approximate waiting times.
- Expert guess – We can have a talk with employees or an expert who is familiar with shopping habits in the local area. The advantage of the expert guess is the perception of the wider context (the real causes of the queue). The disadvantage is that an expert guess is always subjective.
- Google Maps (histogram of popular times) – Everything is done for us. Unfortunately, there is one catch. We only have information from those devices that send their GPS to Google. Moreover, it is not clear whether these people actually were shopping or just waiting for a while near to the store.
The Google Maps method lead us to another important thing – the amount of data for different customer segments.
Data quantity
In reality, the customer base could be spread across several segments based on demography, business type or some other criteria. Membership of the segment is often a predictor on its own, nevertheless, there is a problem that is usually not apparent at first sight.
- How should training data be created considering the data distribution across all segments?
- Can we use the AI model for all customers?
The machine learning process creates a mathematical representation of the training data. Disproportion in the training data will skew the model towards trends which are present in overrepresented segments. If we try to correct this disproportion by cutting some data points from the overrepresented groups, we risk insufficient coverage of the search space (the set of all possible solutions).
What can happen if you underestimate the data preparation? See this article in our “Unlocking AI potential in e-commerce and online business” focused on ethical aspects in AI.
Fortunately, we can solve this kind of issue by using a fallback model:
- We will create multiple mathematical models. The first one will be a general model trained on all available data. After that we will create a model for different customer segments and their subsets. If we have enough data, we can even create an individual model for each customer.
- When making predictions, we go from the most specific model to the general model. If we have enough data for a particular customer, we use the customer-level model. If we haven’t enough data for the customer but there is enough data for a corresponding customer segment, we use the segment-level model. We can repeat this until we reach the top (general model).

This approach is often use in personalization algorithms – see our previous article.
AI and return of investment (ROI)
In today’s article we have talked more about the data rather than about the AI algorithms. The main reason is that the data quality and availability is why many AI projects fail. If you want to avoid wasting resources, we recommend the following approach:
- Compute the minimum precision of the model to get below the maximum acceptable loss in case of unsuccessful prediction (basically the stop-loss threshold). In our example with the store, we can use the cost of excess employees on the shift to compute the loss.
- Calculate the maximum profit the model can generate. In our example we can think of the missed revenue caused by long queues and bad customer experience.
- Determine the data sources which yield the necessary information. Compute how much it will cost to obtain this data.
- If our available data contains at least part of the needed information (3.), perform a basic statistical analysis. Focus on the standard deviation within different data segments. In our example we can break down the data based on store location or time period (weekends, workdays, big sales). Big deviation means sparse data and higher probability of making a wrong prediction.
- If the standard deviation is acceptable (4.), create several AI model prototypes for different segments, feature combinations and data granularity. Test those models and focus on the consistency. Consistent performance during the testing increases the probability that you will get similar performance after deployment.
- If the performance of the best model prototypes (5.) does not meet the stop-loss threshold (1.) and the additional data (3.) and development of a more advanced model cost more than the maximum profit (2.), we suggest you do not proceed further.
What next?
Would you like to see some practical examples how to approach predictive analytics using AI and Data Science? We will release the next Python template soon. Stay tuned!
About the author
My name is Ondřej Kopička and I help companies automate data analysis.
Does the volume of your data exceed the capacity of your analysts? Then we should talk.
Connect with me on LinkedIn: https://www.linkedin.com/in/ondrej-kopicka/